Difference between revisions of "File:Measured high resolution folding ADC.png"
From iis-projects
(Left: Measured output spectrum of a sinusoidal input signal at 60.123 MHz sampled at 150 MHz. Right: Chip micrograph of the implemented ADC in 130 nm CMOS.) |
(No difference)
|
Latest revision as of 17:38, 29 January 2014
Left: Measured output spectrum of a sinusoidal input signal at 60.123 MHz sampled at 150 MHz. Right: Chip micrograph of the implemented ADC in 130 nm CMOS.
File history
Click on a date/time to view the file as it appeared at that time.
| Date/Time | Thumbnail | Dimensions | User | Comment | |
|---|---|---|---|---|---|
| current | 17:38, 29 January 2014 | 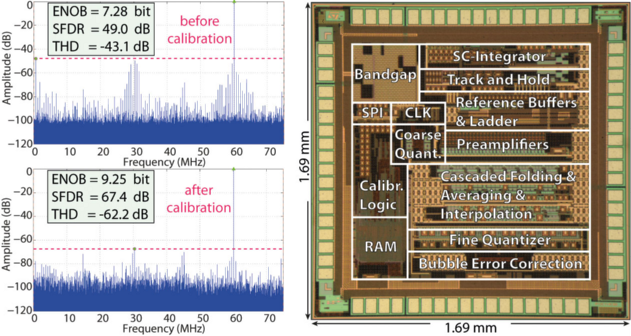 | 631 × 336 (322 KB) | Kgf (talk | contribs) | Left: Measured output spectrum of a sinusoidal input signal at 60.123 MHz sampled at 150 MHz. Right: Chip micrograph of the implemented ADC in 130 nm CMOS. |
- You cannot overwrite this file.
File usage
The following page links to this file:
